Introduce a very useful Java process monitoring tool, which can print out the average time and maximum time consumption of each method in the Java class, which is very helpful for troubleshooting delays in Java programs. The name of this tool is: Greys-Anatomy.
Greys positioning is a professional JVM business problem location tool. Since it is a JVM, most of the things we face are Java programmers. I hope to share all the skills and ideas I have when writing software, so that more Java programmers can participate in or benefit from development.
Main characteristics
View class and method information that has been loaded by the JVM
1, method execution monitoring
Call volume, success failure rate, response time
2, the method performs data operations
Input parameters, return value, exception information record and view; support action playback
3, performance overhead rendering
Tracking method call trajectories in a specified path, taking time
View method call stack
Download and install
Reference: https://github.com/oldmanpushcart/greys-anatomy
After the installation is complete, you can write a shell script, similar to the following (my-gresy.sh, assuming the java program is in the tomcat container):
JAVA_HOME=/usr/lib/jvm/jre-1.8.0-openjdk.x86_64/
CLASS_PATH=.:$JRE_HOME/lib
PATH=$PATH:$JAVA_HOME/bin:$JRE_HOME/bin
Export JAVA_HOME JRE_HOME CLASS_PATH PATH
Pid=$(ps -ef | grep -i tomcat-8.5-1 | grep -v 'grep'| awk '{print $2}')
/data/greys/greys.sh [email protected]:3258|tee -a /data/gresy/gresy.log
Execution script
> sh my-gresy.sh
The following interface appears
Then execute the monitor -c 5 com.my.api.* * command to print the monitoring information every 5 minutes, as follows:
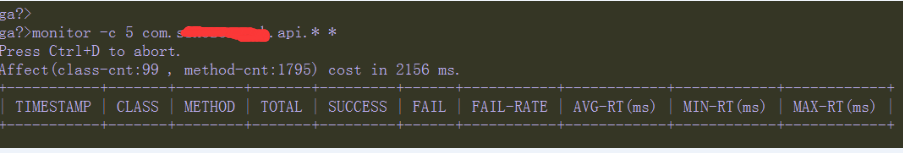
By printing the information, you can find out which method takes the longest time to execute.