Ⅰ Problem
In real-world enterprise Java development, sometimes we encounter the following problems:
OutOfMemoryError
Memory leak
Thread deadlock
Lock Contention
Java process consumes too much CPU
……
These problems may be overlooked by many people in daily development (for example, some people encounter the above problems just restart the server or increase the memory, but do not go deep into the root cause of the problem), but the ability to understand and solve these problems is advanced by Java programmers. Essential requirements. This article will introduce some common JVM performance tuning monitoring tools hprof.
Ⅱ the generation of hprof files
The hprof file can be generated in DDMS (the full name of DDMS is DalvikDebug Monitor Service, which is the Dalvik virtual machine debugging monitoring service in Android development environment. Provides test device screen capture, view the running thread of specific process and heap information, Logcat, broadcast status information, Analog phone call, analog receiving and sending SMS, virtual geographic coordinates, etc.) Select the process by clicking the “dump hprof file” button in the upper left corner of the window to generate it directly. It can also be generated by adding code in the program. The following generates hprof file by setting.
We want to automatically generate the heap dump file when the memory overflows. To do this, we add the JVM arguments at runtime:
-XX:+HeapDumpOnOutOfMemoryError
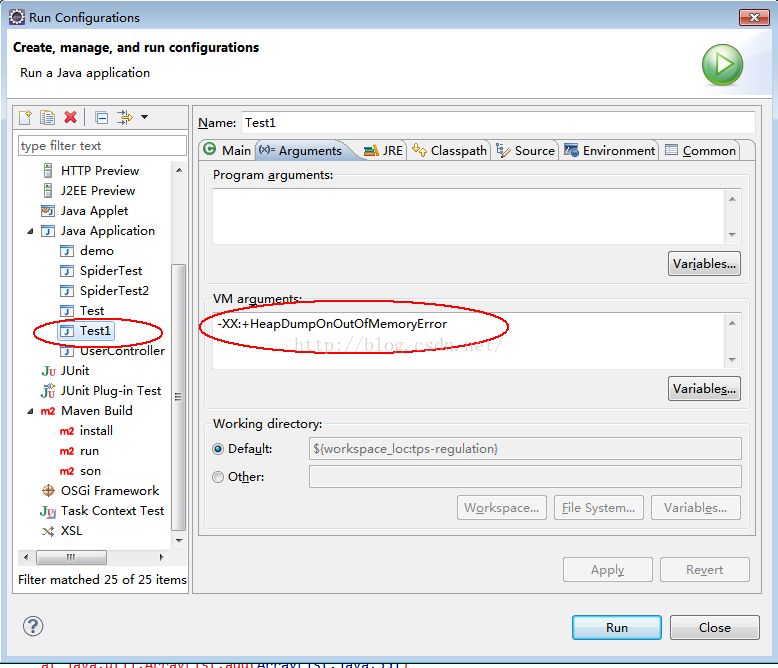
Note: The .hprof file generated by dump is placed under the project directory by default.
First construct an entity class User, this User class is a general java class, then we construct an ArrayList, and then put an instance of this User class in an infinite loop, because the User class and ArrayList are on the heap, and ArrayList is a Strong reference, so can not be recycled by the GC, (because our List has been used and not destroyed), so once the heap memory occupied by the ArrayList fills the entire heap size, the heap overflows.
package com.deppon.tps;
public class User {
	private String name;
	private String sex;
	private int age;
	public String getName() {
		return name;
	}
	public void setName(String name) {
		this.name = name;
	}
	public String getSex() {
		return sex;
	}
	public void setSex(String sex) {
		this.sex = sex;
	}
	public int getAge() {
		return age;
	}
	public void setAge(int age) {
		this.age = age;
	}
    public User( String name,String sex,int age){
        this.name=name;
        this.sex=sex;
        this.age=age;
    }
}
Then we create a main method is inside the Test1 class, create an ArrayList, and infinitely add a User class object to it is:
package com.deppon.tps;
import java.util.ArrayList;
import java.util.List;
public class Test1 {
public static void main(String[] args) {
List<User> persons = new ArrayList<User> ();
while( 1>0){
persons.add( new User("liuhai","male",25));
}
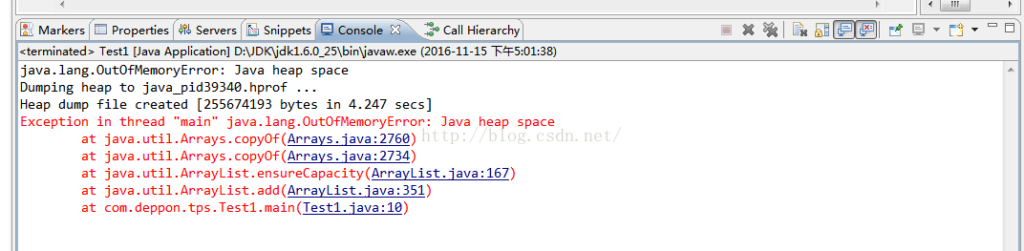
}When running the above code, the heap overflows and a heap dump file is generated (here the VM parameter specifies that if the heap overflows, a heap dump is generated)
Use the MAT (Memory Analyze Tool) tool — plugin to download, install and open the hprof file. and analyze this hprof file (java_pid32430.hprof). We found that it did detect the memory leak problem, as follows:
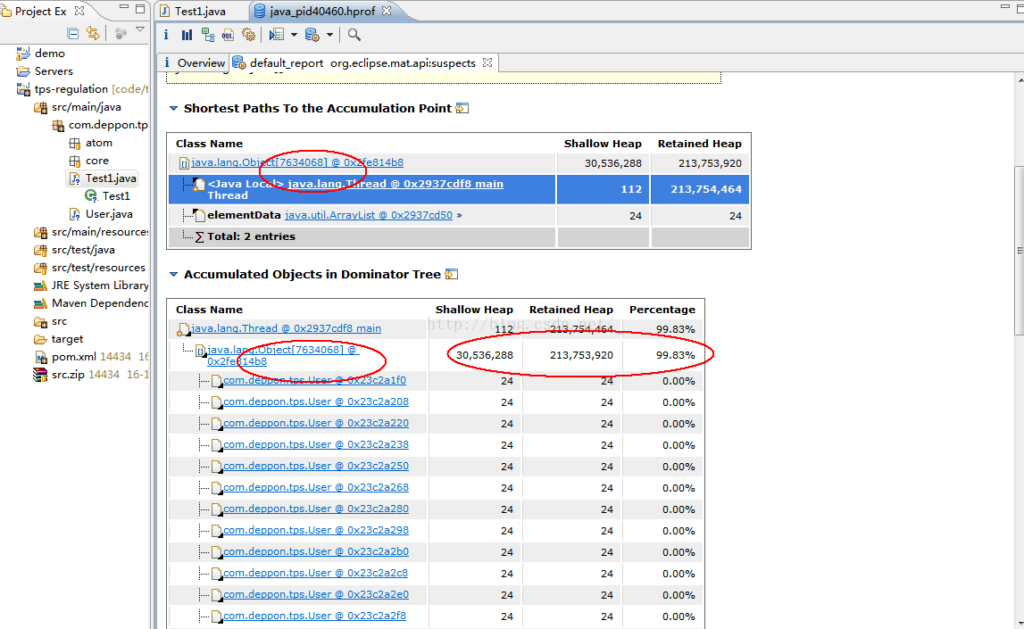
As shown, it is clear here that there is a collection type in the main() method, and then each element in the collection is an object of com.charles.research.User, and each object’s Shallow Heap and Retained Heap size is 24bytes. Because the ArrayList always exists, when the object is long enough, the heap is filled and overflows. Here we created 76,430,681 User objects, each occupying 24 bytes, so it occupies a total of 24 * 7634068 = 1332217632 bytes, which is about 174.72M of heap space. Here, the S hallow Size and Retained Size of the User object are both 24 bytes?
What do we want to look at for Shallow Size and Retained Size?
Shallow Size is the size of the memory occupied by the object itself, and does not contain the object it references. The Shallow Size for regular objects (non-array) is determined by the number and type of its member variables, and the ShallowSize of the array is determined by the array type and array length, which is the sum of the array element sizes.
Retained Size=The current object size + the sum of the sizes of the objects that the current object can be directly or indirectly referenced. (Indirect reference meaning: A->B->C, C is an indirect reference), and excludes objects directly or indirectly referenced by GC Roots
So, our User class here, because our machine is a 32-bit WIN7 system, so the object header occupies 8 bytes, it contains a String object reference (name), occupies 4 bytes, contains a String object reference (sex), occupies 4 bytes, contains an int type (age), occupying 4bytes, so it occupies a total of 8+4+4+4=20bytes, because the number of digits is to be filled, so the final size is 24bytes. This is the size of the object itself (Shallow Heap).
Tip: In order to explain the completion, you can also experiment. If we add a String member to User, then the User class size is still 24 bytes, because the reference to this new String object is just 4 bytes to fill the pit. Adding a String member, the size of the User class is directly increased from 24 bytes to 32 bytes, because another pit needs to be filled.
And our User class does not introduce other classes (not including String, because String is directly referenced by the Root GC), so recycling the memory occupied by User is to recycle the User itself, so the Retained Heap size is equivalent to the Shallow Heap size.
Ⅲ set jvm parameters in tomcat
- Open the /tomcat_home/bin/catalina.sh file
- Plus: JAVA_OPTS=”$JAVA_OPTS -server -XX:+HeapDumpOnOutOfMemoryError -XX:HeapDumpPath=D:\heapdump”
Note: When -XX:HeapDumpPath is not set, the files that are dumped are in the /tomcat_home/bin directory.
Windows system
- Open the /tomcat_home/bin/catalina.bat file
- Plus: set JAVA_OPTS=%JAVA_OPTS% -server -XX:+HeapDumpOnOutOfMemoryError -XX:HeapDumpPath=D:\heapdump
As shown below: