Arthas is an open source tool for Java developed by Alibaba recently. It mainly for diagnosing the problems of java.
I. Overview
This tool can help you do the following things:
- Which jar package loaded this class from?
- Why do you code throws various kinds of Exceptions?
- If you encounter problems on product environment , you can’t debug well. Can you only add System.out on your code and republish it again and again to find problem by adding logs?
- Why hasn’t the online code been executed here? Is it because there is no commit in the code? Or is it the wrong branch code?
- There is a problem with the data processing of a user online, but it can not debug online and can not be reappear offline.
- Is there a global perspective to see how the system works?
- What is the way to monitor the real-time running state of JVM?
II. Installation Method
1.1 Windows Installation Mode
Download address: http://search.maven.org/classic/#search%7Cga%7C1%7Cg%3A%22com.taobao.arthas%22%20AND%20a%3A%22arthas-packaging%22
After downloading, decompress, as shown in the following:
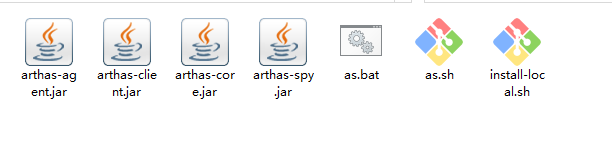
Download the latest “bin.zip” package file. After decompression, there is a file named “as.bat” in the bin directory. For the time being, this script accepts only one parameter “pid”, so it can only diagnose Java processes on one machine.
The startup command is:
as.bat <pid>Note: When I started Windows 10, I encountered the following problems
D:\download\arthas-packaging-3.0.4-bin > telnet 'telnet'is not an internal or external command, nor is it a runnable program Or batch files.The solution is: Control Panel – > Start or Close Windows Function – > Check Telnet Function
1.2 Linux Installation Mode
Install Arthas:
curl -L https://alibaba.github.io/arthas/install.sh | shStart Arthas:
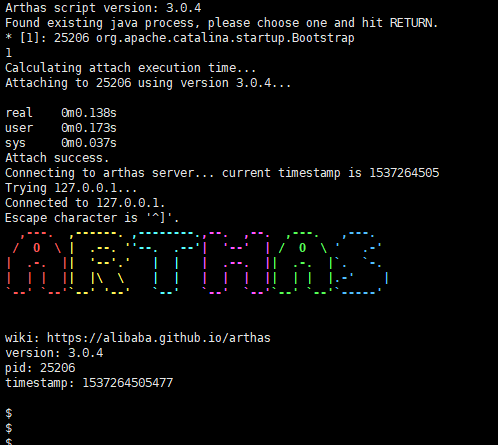
./as.shAfter successful startup, you will see the following interface.
III. Common orders
3.1 Basic Command
Help — View command help information
CLS – Clear the current screen area
Session — View information about the current session
Reset – Reset Enhanced Classes, which will be restored to all classes enhanced by Arthas. When the Arthas server is closed, all enhanced classes will be reset.
Version — Outputs the version number of Arthas loaded by the current target Java process
Quit – Exit the current Arthas client, other Arthas clients are unaffected
Shutdown – Close the Arthas server and all Arthas clients quit
Keymap – Arthas shortcut list and custom shortcut keys
JVM correlation
Dashboard – Real-time Data Panel for Current System
Thread — View thread stack information for the current JVM
JVM — View the current JVM information
Sysprop — Viewing and modifying JVM system properties
New! Getstatic — View static properties of classes
Class / classloader correlation
SC — View class information loaded by JVM
SM — View method information for loaded classes
Dump – dump loaded class byte code to a specific directory
Redefine – Load external. class files, redefine to JVM
JAD — Decompiles the source code that specifies the loaded class
Classloader – View the inheritance tree, urls, class loading information of classloader, and use classloader to getResource
Monitor/watch/trace correlation
Note that these commands are implemented by bytecode enhancement technology, which inserts some aspect into the method of the specified class to achieve data statistics and observation. Therefore, when online and pre-sent, please try to identify the classes, methods and conditions that need to be observed, and execute shutdown command at the end of diagnosis or execute reset command for enhanced class.
Monitor — Method Execution Monitoring
Watch – Method Executes Data Observation
Trace — Invoke paths within methods and output time-consuming paths on each node on the method path
Stack — Outputs the call path for the current method to be invoked
TT – Method executes the time-space tunnel of data, records the input and return information of each call of the specified method, and can observe these calls at different times.
Options
Options — View or set the Arthas global switch
Pipeline
Arthas supports the use of pipes to further process the results of the above commands, such as SM org. apache. log4j. Logger | grep
Grep — Search for results that satisfy conditions
Plaintext — Remove the color from the result of the command
WC – Statistical output by line
Web Console
Connect Arthas through websocket.
Other features
Asynchronous command support
Execution results are logged
Batch processing support
Usage Description of ognl Expressions
3.2 Use examples
First, in the window, enter help to see all available commands provided (the communication is essentially through telnet protocol), as follows:
Attach success.
Connecting to arthas server... current timestamp is 1537266148
Trying 127.0.0.1...
Connected to 127.0.0.1.
Escape character is '^]'.
  ,---.  ,------. ,--------.,--.  ,--.  ,---.   ,---.
 /  O  \ |  .--. ''--.  .--'|  '--'  | /  O  \ '   .-'
|  .-.  ||  '--'.'   |  |   |  .--.  ||  .-.  |`.  `-.
|  | |  ||  |\  \    |  |   |  |  |  ||  | |  |.-'    |
`--' `--'`--' '--'   `--'   `--'  `--'`--' `--'`-----'


wiki: https://alibaba.github.io/arthas
version: 3.0.4
pid: 25206
timestamp: 1537266148841

$ help
 NAME         DESCRIPTION
 help         Display Arthas Help
 keymap       Display all the available keymap for the specified connection.
 sc           Search all the classes loaded by JVM
 sm           Search the method of classes loaded by JVM
 classloader  Show classloader info
 jad          Decompile class
 getstatic    Show the static field of a class
 monitor      Monitor method execution statistics, e.g. total/success/failure count, average rt, fail rate, etc.
 stack        Display the stack trace for the specified class and method
 thread       Display thread info, thread stack
 trace        Trace the execution time of specified method invocation.
 watch        Display the input/output parameter, return object, and thrown exception of specified method invocation
 tt           Time Tunnel
 jvm          Display the target JVM information
 dashboard    Overview of target jvm's thread, memory, gc, vm, tomcat info.
 dump         Dump class byte array from JVM
 options      View and change various Arthas options
 cls          Clear the screen
 reset        Reset all the enhanced classes
 version      Display Arthas version
 shutdown     Shut down Arthas server and exit the console
 session      Display current session information
 sysprop      Display, and change the system properties.
 redefine     Redefine classes. @see Instrumentation#redefineClasses(ClassDefinition...)
$
Here we mainly talk about watch, which monitors variables.
First, paste my test code:
package com.oct.tail;

import java.util.UUID;

/**
 * @Author Ryan
 * @Date 2018/9/18  9:58
 * @desc
 */
public class OtherTestCase {

    /**
     *
     * @return
     */
    public static String uuid(){
       return UUID.randomUUID().toString().replaceAll("-", "");
    }

    public static void main(String[] args) {

        while(true){
            System.out.println("uuid = " + uuid());

            try {
                Thread.sleep(1000);
            } catch (InterruptedException e) {
                e.printStackTrace();
            }
        }
    }
}
Here’s an example (I’m based on Windows 10, JDK 8 environment, Linux is the same). (For the watch command, I pretend I don’t know how to use it, and immediately enter watch help to see what’s going to happen.)
 ,---.  ,------. ,--------.,--.  ,--.  ,---.   ,---.
 /  O  \ |  .--. ''--.  .--'|  '--'  | /  O  \ '   .-'
|  .-.  ||  '--'.'   |  |   |  .--.  ||  .-.  |`.  `-.
|  | |  ||  |\  \    |  |   |  |  |  ||  | |  |.-'    |
`--' `--'`--' '--'   `--'   `--'  `--'`--' `--'`-----'


wiki: https://alibaba.github.io/arthas
version: 3.0.4
pid: 11924
timestamp: 1537326702039

$ watch -help
 USAGE:
   watch [-b] [-e] [-x <value>] [-f] [-h] [-n <value>] [-E] [-M <value>] [-s] class-
 pattern method-pattern express [condition-express]

 SUMMARY:
   Display the input/output parameter, return object, and thrown exception of specif
 ied method invocation
   The express may be one of the following expression (evaluated dynamically):
           target : the object
            clazz : the object's class
           method : the constructor or method
     params[0..n] : the parameters of method
        returnObj : the returned object of method
         throwExp : the throw exception of method
         isReturn : the method ended by return
          isThrow : the method ended by throwing exception
            #cost : the execution time in ms of method invocation
 Examples:
   watch -Eb org\.apache\.commons\.lang\.StringUtils isBlank params[0]
   watch -b org.apache.commons.lang.StringUtils isBlank params[0]
   watch -f org.apache.commons.lang.StringUtils isBlank returnObj
   watch -bf *StringUtils isBlank params[0]
   watch *StringUtils isBlank params[0]
   watch *StringUtils isBlank params[0] params[0].length==1
   watch *StringUtils isBlank '#cost>100'

 WIKI:
   https://alibaba.github.io/arthas/watch

 OPTIONS:
 -b, --before                Watch before invocation
 -e, --exception             Watch after throw exception
 -x, --expand <value>        Expand level of object (1 by default)
 -f, --finish                Watch after invocation, enable by default
 -h, --help                  this help
 -n, --limits <value>        Threshold of execution times
 -E, --regex                 Enable regular expression to match (wildcard matching b
                             y default)
 -M, --sizeLimit <value>     Upper size limit in bytes for the result (10 * 1024 * 1
                             024 by default)
 -s, --success               Watch after successful invocation
 <class-pattern>             The full qualified class name you want to watch
 <method-pattern>            The method name you want to watch
 <express>                   the content you want to watch, written by ognl.
                             Examples:
                               params[0]
                               'params[0]+params[1]'
                               returnObj
                               throwExp
                               target
                               clazz
                               method

 <condition-express>         Conditional expression in ognl style, for example:
                               TRUE  : 1==1
                               TRUE  : true
                               FALSE : false
                               TRUE  : 'params.length>=0'
                               FALSE : 1==2


$
Here, we monitor the return value of method UUID (). The monitoring results are as follows:
$
$
$ watch -f com.oct.tail.OtherTestCase uuid returnObj
Press Ctrl+C to abort.
Affect(class-cnt:1 , method-cnt:1) cost in 18 ms.
ts=2018-09-19 11:13:48;result=@String[26c80eb505664dbcb14f8d810fb4811c]
ts=2018-09-19 11:13:49;result=@String[fc03c43864f94372b646ce6253d90646]
ts=2018-09-19 11:13:50;result=@String[55ff41e0d66347c2bc75ab8ff4ffda4e]
ts=2018-09-19 11:13:51;result=@String[c504388c0aa74458a41a1b3a77c3d536]
ts=2018-09-19 11:13:52;result=@String[18d59c09ffde4c7aab15feb88b3e433f]
ts=2018-09-19 11:13:53;result=@String[c19dd8c1e5f8442696c8f886e81e74d5]
ts=2018-09-19 11:13:54;result=@String[d37a74aa502f4897aa1ed84dc69b83d8]
ts=2018-09-19 11:13:55;result=@String[cc11753b6f424c1e9a6a1ab36f334349]
ts=2018-09-19 11:13:56;result=@String[75a9b3c0bed4426d9363168912f16d74]
ts=2018-09-19 11:13:57;result=@String[f13022118e5a4115800a6eacc480e6a8]
It works so well that I can hardly believe it.